Last article in our series on the use of visual management according to our FLOW Project Management methodology. If you first want to (re) read the previous articles, click the following links: Analytical gain of the Fever Chart: Introduction Distribute tasks between...
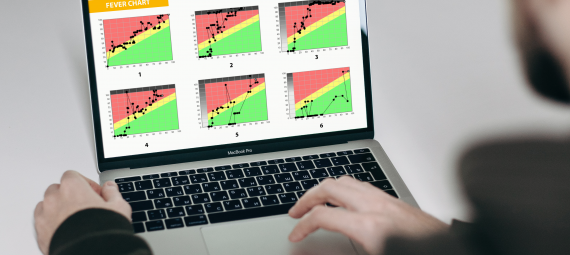
In this series of articles intended for visual management according to our FLOW Project Management approach, we will see how the use of fever charts can help you detect and implement continuous improvement actions. If you want to (re) read the previous articles, click...
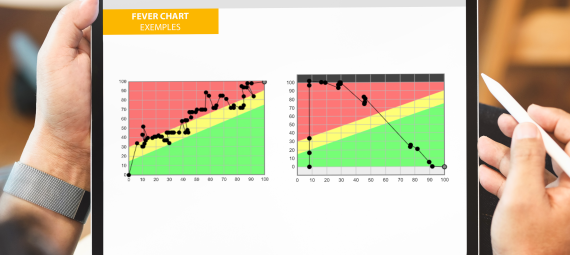
Today, we will see how we can use the fever chart to remake the project’s history. Let’s continue our serie of article devoted to visual management, associated with our FLOW Project Management approach, and focus on the project’s history. If you would like...
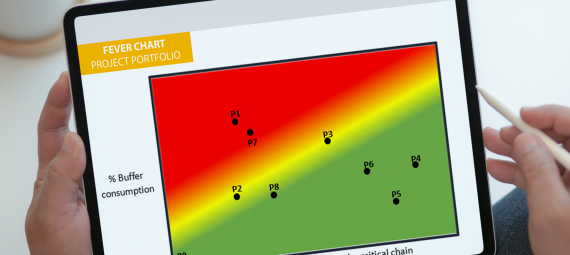
In this serie of articles devoted to visual management in project management, today we will discuss how to use the fever chart to manage a project portfolio. Talking about visual management … Let’s take the graph below and see what we can observe: In most of the...
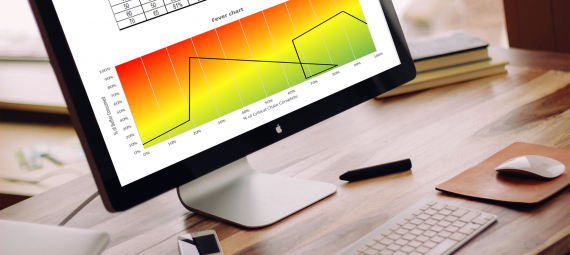
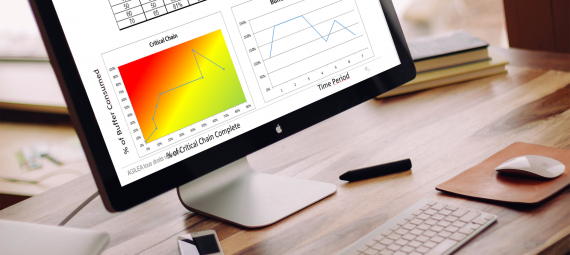
Usually, when we do the FLOW Project Management training, most of the people trained fall under the spell of the performance indicator called the Fever Chart (see the graph below). Its colorful side greatly helps in decision-making and becomes addictive to know the...