
In the first season, you discovered the different ways to analyze a Fever Chart. It’s time to start season 2, which will focus on the use of a project plan.
In this article, we will describe:
- what a project plan is,
- why do we do it,
- its benefits
- and the risks associated with not having one.
In the following articles, we will clarify:
– how to split a project,
– to which level of granulometry it is necessary to go,
– how to reduce the duration of a project
– and finally, the eternal debate about the resources load and capacity in project management tools.
But first, what is a project plan?
If you don’t always agree on what it actually means when your project is done. Or if you are missing inputs to start some tasks, while the upstream teams are sure that they have completed their work properly… Then your project plan is flawed!
Project schedule network diagrams show the order in which activities should be scheduled to address logical relationships between these activities. It is drawn from left to right to represent the chronology of the project (Source PMI, Project Schedule Network Diagram).
Where the WBS (Work Breakdown Structure) strives to clarify the nomenclature of the project, the project plan (Network Diagram) seeks to establish the range and therefore the relationship between the tasks.
To use an analogy found on the web, it is the story of the philosophy teacher who fills a jar with pebbles in front of his students. When the jar is full of large stones, he asks his audience if the jar is full. The students confirm. Then the teacher takes some gravel and comes to fill the jar with it. And so on.
The construction principle is exactly the same.
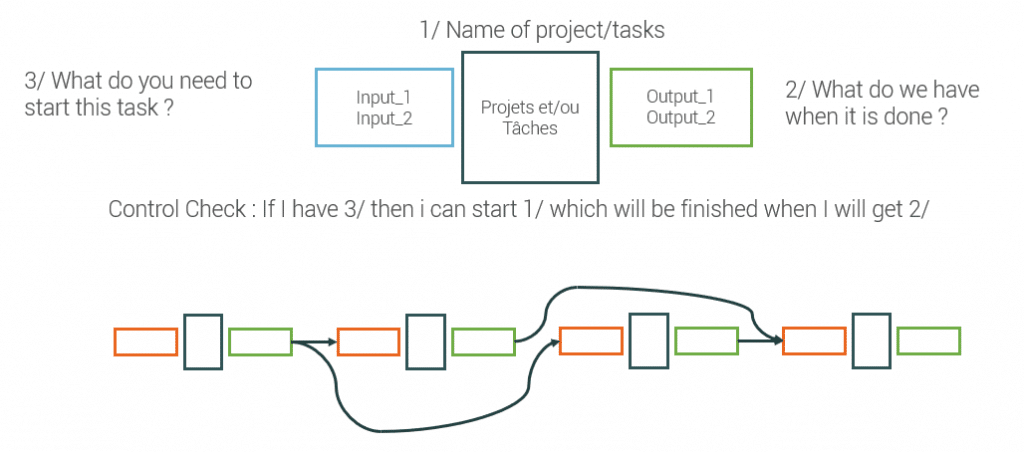
At the highest point, we will identify the name of the project as well as the necessary deliverables and input data. For this, two questions will guide us:
- What does it mean when it’s done?
- What is needed to start this project/task?
When this step is completed, we will look to identify the major steps of this project (not necessarily milestones). The question we often ask our clients is:
How would you sum up your project in 3 to 5 ideas?
For each of the ideas identified, we will ask the first two questions, to clarify the deliverables and inputs needed to complete these steps.
Next, we will:
- Create the links between these steps,
- Detail each of these steps with question 3, then clarify the deliverables and inputs.
When this process is done, the creation of links may reveal several cases:
- A deliverable is not linked to an input of another task: in this case, the question is to determine the relevance of this deliverable. If the relevance is real, it tells you that there are missing tasks to complete the Network Diagram.
- The input data is not an upstream deliverable: the reasoning is exactly the same but in the other direction 😉.
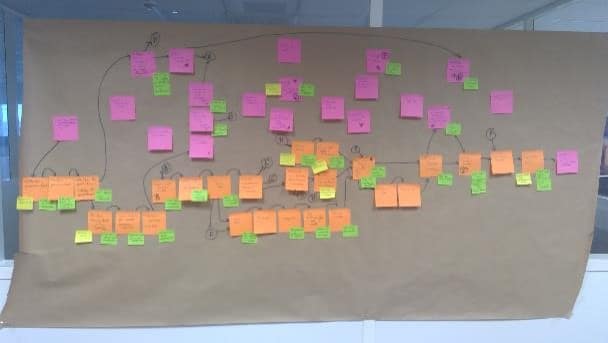
When you’re done, you’ll get something that looks like this:
At the end of this process, you will be able to identify the skills needed for each task and the associated estimated duration. This is not to get into a debate about task estimation, but if you are familiar with our approach, you know that it is better to enter safe durations in order to exploit these margins in a different way.
You may have noticed that this process is iterative. The corollary is at what point should I stop iterating? When my projects are very long, how do I manage a multi-year project? And so on…
The question that emerges is: To what level of detail should I go in defining my tasks?
More in episode 2…
Ps : Below is a link that details the whole process. It was written by Mrs Austin and is, in my opinion, the best description of what a Network Diagram is.